Pakistan / Administrative-unit atlas
Explore all 34 proposed units.
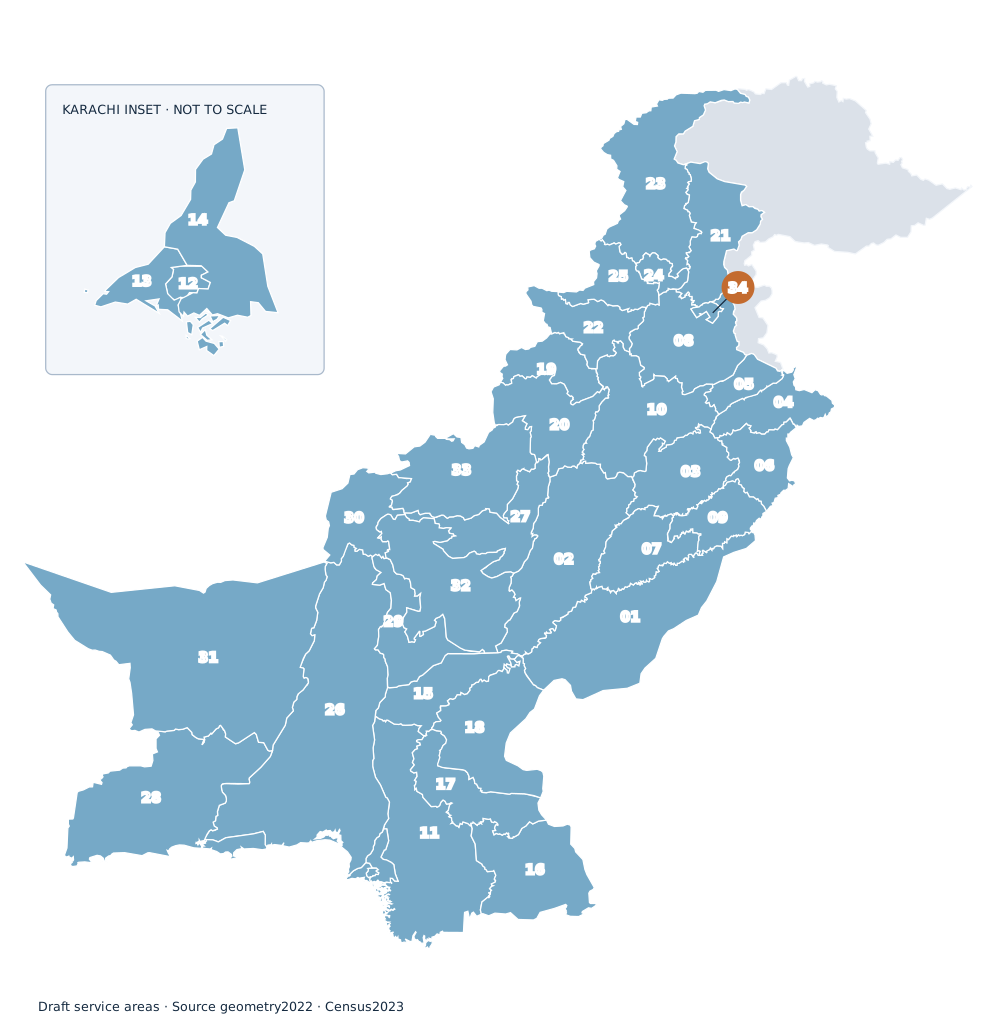
Census profiles for a draft service geography. Each of 136 reporting districts is assigned once; current legal boundaries and elected-council membership still require verification.
Choose what the map shows
Continuous linear scale · Dark outline marks the selected unit.
Every unit, in one table.
Counts are from Census 2023. Age, literacy and household measures use the detailed-information universe, which can be smaller than headline population.
| Unit | Territory | Population | Urban | Female | Under 15 | Literacy 10+ | Female literacy 10+ | Households | Detailed coverage | Districts |
|---|---|---|---|---|---|---|---|---|---|---|
| 01 Bahawalpur | Punjab | 13,400,009 | 29.4% | 48.4% | 41.3% | 52.1% | 45.0% | 2,060,013 | 99.8% | Bahawalnagar, Bahawalpur, Rahim Yar Khan |
| 02 Dera Ghazi Khan | Punjab | 12,892,465 | 21.5% | 49.2% | 45.5% | 48.0% | 39.2% | 1,955,041 | 99.5% | Dera Ghazi Khan, Layyah, Muzaffargarh, Rajanpur |
| 03 Faisalabad | Punjab | 16,228,526 | 38.5% | 48.2% | 36.5% | 68.8% | 62.6% | 2,527,950 | 99.9% | Chiniot, Faisalabad, Jhang, Toba Tek Singh |
| 04 Gujranwala | Punjab | 13,730,007 | 43.2% | 49.2% | 37.4% | 76.0% | 73.6% | 2,000,018 | 99.7% | Gujranwala, Hafizabad, Narowal, Sialkot |
| 05 Gujrat–Mandi Bahauddin | Punjab | 5,048,861 | 33.1% | 50.0% | 34.3% | 77.4% | 73.6% | 775,757 | 99.9% | Gujrat, Mandi Bahauddin |
| 06 Lahore | Punjab | 22,772,710 | 70.8% | 47.8% | 37.2% | 73.6% | 70.3% | 3,498,991 | 99.9% | Kasur, Lahore, Nankana Sahib, Sheikhupura |
| 07 Multan | Punjab | 14,085,102 | 30.7% | 48.9% | 38.8% | 59.4% | 51.9% | 2,281,317 | 99.8% | Khanewal, Lodhran, Multan, Vehari |
| 08 Rawalpindi | Punjab | 11,406,496 | 50.9% | 49.4% | 33.0% | 79.6% | 73.1% | 1,871,806 | 99.0% | Attock, Chakwal, Jhelum, Rawalpindi |
| 09 Sahiwal | Punjab | 8,533,471 | 28.3% | 49.2% | 39.1% | 61.0% | 54.2% | 1,341,588 | 99.8% | Okara, Pakpattan, Sahiwal |
| 10 Sargodha | Punjab | 9,591,275 | 28.6% | 48.9% | 37.3% | 63.2% | 52.6% | 1,543,421 | 99.9% | Bhakkar, Khushab, Mianwali, Sargodha |
| 11 Hyderabad | Sindh | 11,659,246 | 37.3% | 48.3% | 42.4% | 45.4% | 37.5% | 2,246,096 | 100.0% | Badin, Dadu, Hyderabad, Jamshoro, Matiari, Sujawal, Tando Allahyar, Tando Muhammad Khan, Thatta |
| 12 Karachi Central–East | Sindh | 7,744,067 | 100.0% | 47.0% | 34.7% | 81.8% | 80.9% | 1,318,228 | 99.9% | Karachi Central, Karachi East |
| 13 Karachi Harbour–West | Sindh | 7,077,595 | 96.5% | 46.9% | 35.7% | 69.7% | 66.3% | 1,210,976 | 100.0% | Karachi South, Karachi West, Keamari |
| 14 Karachi Malir–Korangi | Sindh | 5,561,219 | 77.2% | 47.1% | 37.9% | 72.6% | 69.4% | 910,016 | 99.8% | Korangi, Malir |
| 15 Larkana | Sindh | 7,093,706 | 30.6% | 48.6% | 48.6% | 44.5% | 34.6% | 1,208,563 | 100.0% | Jacobabad, Kambar Shahdad Kot, Kashmore, Larkana, Shikarpur |
| 16 Mirpur Khas | Sindh | 4,619,624 | 19.4% | 47.7% | 48.0% | 40.4% | 28.2% | 863,467 | 100.0% | Mirpur Khas, Tharparkar, Umer Kot |
| 17 Shaheed Benazirabad | Sindh | 5,930,649 | 29.3% | 49.2% | 44.2% | 49.9% | 39.6% | 1,061,799 | 100.0% | Naushahro Feroze, Sanghar, Shaheed Benazirabad |
| 18 Sukkur | Sindh | 6,010,041 | 33.9% | 48.3% | 45.2% | 49.7% | 37.0% | 1,052,475 | 99.6% | Ghotki, Khairpur, Sukkur |
| 19 Bannu | Khyber Pakhtunkhwa | 3,092,078 | 5.0% | 48.6% | 46.5% | 42.1% | 24.3% | 414,765 | 99.7% | Bannu, Lakki Marwat, North Waziristan |
| 20 Dera Ismail Khan | Khyber Pakhtunkhwa | 3,188,779 | 13.3% | 47.9% | 45.0% | 41.7% | 28.5% | 519,548 | 99.8% | Dera Ismail Khan, South Waziristan, Tank |
| 21 Hazara | Khyber Pakhtunkhwa | 6,188,736 | 10.3% | 49.4% | 41.3% | 61.0% | 50.3% | 1,003,686 | 97.4% | Abbottabad, Batagram, Haripur, Kolai Palas Kohistan, Lower Kohistan, Mansehra, Torghar, Upper Kohistan |
| 22 Kohat | Khyber Pakhtunkhwa | 3,752,436 | 12.5% | 48.8% | 43.3% | 50.9% | 32.5% | 473,606 | 99.9% | Hangu, Karak, Kohat, Kurram, Orakzai |
| 23 Malakand | Khyber Pakhtunkhwa | 9,959,399 | 10.2% | 49.5% | 45.4% | 47.5% | 33.4% | 1,345,243 | 99.9% | Bajaur, Buner, Lower Chitral, Lower Dir, Malakand, Shangla, Swat, Upper Chitral, Upper Dir |
| 24 Mardan | Khyber Pakhtunkhwa | 4,639,498 | 17.1% | 49.0% | 40.7% | 56.9% | 43.4% | 679,939 | 99.8% | Mardan, Swabi |
| 25 Peshawar | Khyber Pakhtunkhwa | 10,035,171 | 26.3% | 48.7% | 42.7% | 51.3% | 37.7% | 1,446,220 | 99.9% | Charsadda, Khyber, Mohmand, Nowshera, Peshawar |
| 26 Kalat | Balochistan | 2,721,018 | 31.7% | 47.6% | 49.6% | 38.7% | 29.7% | 433,209 | 100.0% | Awaran, Kalat, Khuzdar, Lasbela, Mastung, Surab |
| 27 Loralai | Balochistan | 870,000 | 11.4% | 47.5% | 51.5% | 39.9% | 28.9% | 135,679 | 99.6% | Barkhan, Duki, Loralai, Musakhel |
| 28 Mekran | Balochistan | 1,875,872 | 37.5% | 47.5% | 42.1% | 47.7% | 41.7% | 421,059 | 99.9% | Gwadar, Kech, Panjgur |
| 29 Nasirabad | Balochistan | 2,044,021 | 19.1% | 48.7% | 52.8% | 32.6% | 24.1% | 283,860 | 100.0% | Jaffarabad, Jhal Magsi, Kachhi, Nasirabad, Sohbatpur |
| 30 Quetta | Balochistan | 4,259,163 | 46.4% | 48.4% | 47.7% | 51.7% | 41.1% | 565,181 | 92.4% | Chaman, Killa Abdullah, Pishin, Quetta |
| 31 Rakhshan | Balochistan | 1,040,001 | 18.3% | 47.0% | 53.2% | 36.8% | 27.2% | 154,461 | 99.9% | Chagai, Kharan, Nushki, Washuk |
| 32 Sibi | Balochistan | 1,156,748 | 24.2% | 47.3% | 53.5% | 34.7% | 25.9% | 171,016 | 100.0% | Dera Bugti, Harnai, Kohlu, Sibi, Ziarat |
| 33 Zhob | Balochistan | 927,579 | 12.0% | 46.5% | 55.8% | 32.3% | 21.9% | 154,054 | 100.0% | Killa Saifullah, Sherani, Zhob |
| 34 Islamabad | Islamabad (proposed province) | 2,363,863 | 46.9% | 47.2% | 32.3% | 84.0% | 79.1% | 411,518 | 96.6% | Islamabad |
PBS Tables 1,5,12,21. Rates are recomputed from summed counts and matching denominators, never by averaging district percentages. [96] Read the method.
Newer surveys give provincial context.
HIES 2024–25 is newer than the census, but its provincial estimates cannot be copied into each proposed administrative unit. Internet is a household-access measure. Municipal garbage collection is one provider category, not total collection by all providers.
| Province | Literacy 10+ | Female literacy 10+ | Rural female literacy 10+ | Household internet | Rural household internet | Municipal garbage collection |
|---|---|---|---|---|---|---|
| Punjab | 68% | 62% | 54% | 69% | 60% | 12% |
| Sindh | 58% | 47% | 24% | 67% | 47% | 16% |
| Khyber Pakhtunkhwa | 58% | 43% | 41% | 77% | 75% | 6% |
| Balochistan | 49% | 31% | 25% | 69% | 64% | 1% |
HIES Social Report: printed p 61 education Table 7; p 95 ICT Table 1; p 259 WASH Table 7. No Islamabad estimate is inferred. [85] LFS 2024–25 is stored, but no unit-level unemployment estimate is manufactured. [86]
How the 34-unit draft was assembled
The 2023 census reporting hierarchy contains 9 Punjab divisions, 6 Sindh, 7 KP, 8 Balochistan and one Islamabad case, 31 in total. Separating Gujrat–Mandi Bahauddin from the census Gujranwala division adds one; splitting Karachi into three catchments adds two. This is an analytical choice, not a claim about the current number of notified divisions.
The map uses a legacy district crosswalk. It does not allocate people by polygon area. Keamari is included in the population schedule, but its separate geometry is absent. The exported unions were independently recomputed and checked; that validates the transformation, not current legal geography or boundary suitability.